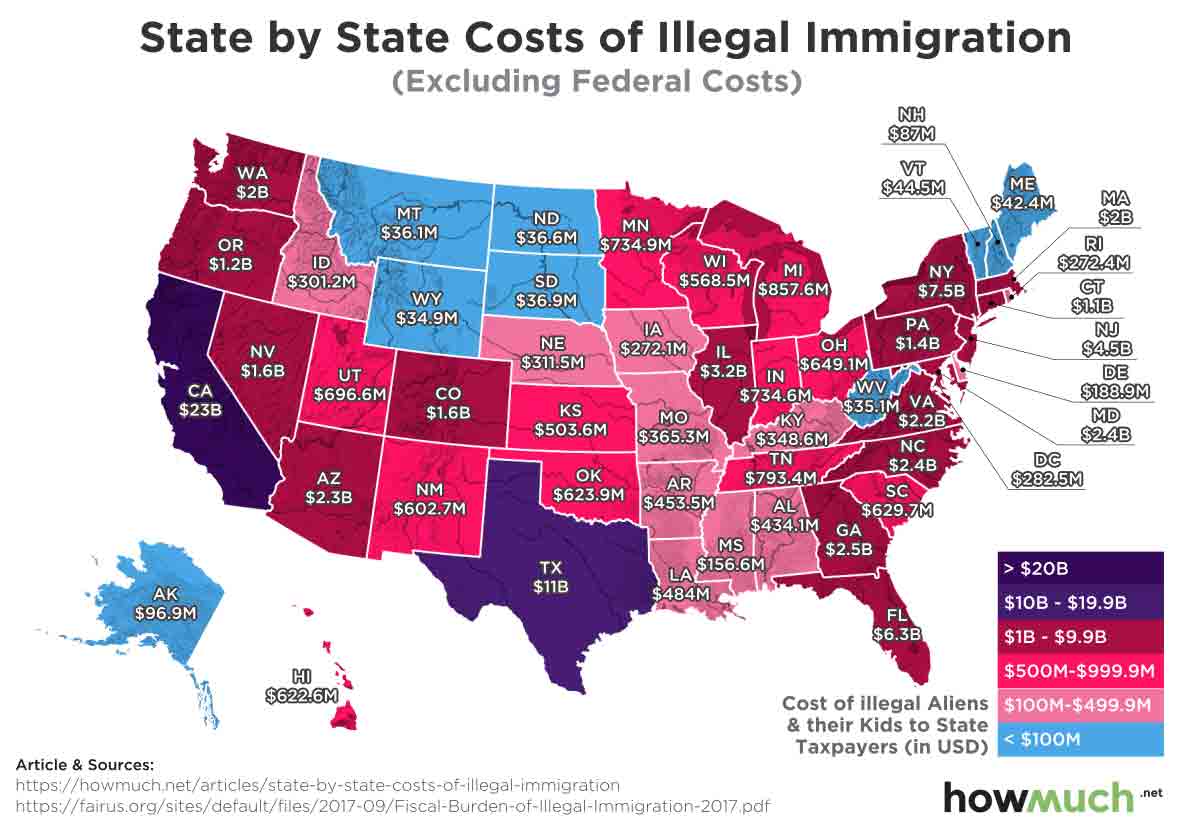
There’s a lot of confusion and misunderstanding out there around the economic impact of illegal immigration in the United States. We decided to bring some clarity around the issue by mapping new numbers on the estimated costs of illegal immigration on a state-by-state basis.
Our viz takes data from the Federation for American Immigration Reform (FAIR) about how much illegal immigration costs in each state. FAIR takes into account a variety of different expenditures, like healthcare, education and refundable tax credits. We mapped these numbers across the United States according to a color-coded scale. Purple and dark red states have comparatively high expenditures, but the pink and blue states spend relatively less money because of illegal immigrants.
There are two interesting trends you can see from looking at the data in this way.
- First, states that spend the most on illegal immigration tend to be located close to Mexico. Looking at out map, the two states with the highest expenditures are California ($23B) and Texas ($11B), both sharing long borders with Mexico. In fact, there’s a cluster of dark red states stretching along the Southwest. States closest to the phenomenon pay the most as a result.
- Second, states with higher population levels tend to spend more than their less populated counterparts. You can see a group of high-expenditure states clustered around the Northeast, not to mention Illinois and Florida. According to the U.S. Census Bureau, California and Texas are also the two most populous states in the country. High population levels and proximity to Mexico act like a double-whammy for illegal immigration expenses.
Now take a look at the places with relatively low levels of expenditures for illegal immigration, the light blue states. They are all located far away from the U.S.-Mexico border with relatively small population levels. West Virginia is perhaps an exceptional state, seeing that it is surrounded by red and dark red. We can speculate that this is likely due to the fact that West Virginia has a struggling economy which actuallycontracted last year.
We should add that the source for the numbers in our viz come from a partisan outfit. The Federation for American Immigration Reform (FAIR) advocates for legislation designed to decrease immigration, and you can poke holes in their methodology. For example, suppose immigrants really are paying less in income taxes because of their illegal status. Forbes estimates that granting them amnesty would actually boost their state tax contributions by $2.1 billion. That’s the exact opposite conclusion than what FAIR would like you to believe.
That being said, here’s a list breaking down the States with the highest expenditures for illegal immigration according to FAIR.
1. California – $23,038,125,353
2. Texas – $10,994,614,550
3. New York – $7,489,141,357
4. Florida – $6,290,429,108
5. New Jersey – $4,466,838,574
6. Illinois – $3,220,767,517
7. Georgia – $2,487,719,503
8. North Carolina – $2,437,965,113
9. Maryland – $2,378,996,947
10. Arizona – $2,314,131,964
Remember, these numbers only look at the net expenditures that states spend on illegal immigration, and they say nothing about other contributions to the economy. Any way you cut it though, whenever states are spending billions of dollars on something, it’s worth taking a hard look at where the money is going and why.


